

chromatography, also known as "chromatographic analysis", "chromatography", is a separation and analysis method, which has a very wide range of applications in analytical chemistry, organic chemistry, biochemistry and other fields.
The founder of chromatography is a Russian botanist M.Tsvetter. In 1906, the Russian botanist Zvetter published the results of his experiment: In order to separate plant pigments, he poured petroleum ether extract containing plant pigments into a glass tube containing calcium carbonate powder and eluted it with petroleum ether from top to bottom. Because different pigments have different adsorption capacities on the surface of calcium carbonate particles, with the process of leaching, different pigments move down at different speeds, thus forming bands of different colors. The pigment components were separated. He named this separation method chromatography.
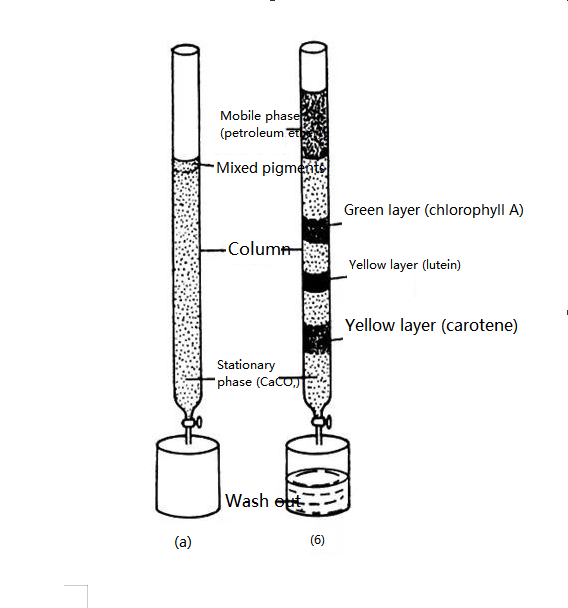
Schematic representation of a plant leaf pigment separation experiment
With the continuous development of separation methods, more and more colorless substances become the object of separation, chromatography also gradually lost the meaning of "color", but the name is still in use today.
Chromatographic classification
The essence of chromatography is a process in which the molecules to be separated are partitioned and balanced between the stationary phase and the mobile phase. Different substances are partitioned differently between the two phases, which makes them move at different speeds with the mobile phase. With the movement of the mobile phase, different components in the mixture are separated from each other on the stationary phase. Depending on the mechanism, it can be divided into a variety of categories.
1, according to the two-phase physical state classification
Mobile phase: Gas chromatography, liquid chromatography, supercritical fluid chromatography
Stationary phase: gas-solid, gas-liquid; Liquid-solid, liquid-liquid
2, according to the form of stationary phase classification
Column chromatography: packed column chromatography, capillary column chromatography, micropacked column chromatography, preparative chromatography
Plane chromatography: paper chromatography, thin layer chromatography, polymer membrane chromatography
3, classified according to the separation mechanism
Adsorption chromatography: Different components are separated according to their adsorption and desorption capacities on adsorbents
Partition chromatography: The different components are separated according to their solubility in the solvent
Molecular exclusion chromatography: according to the size of the molecular size of the separation ln ion exchange chromatography: different components of the affinity for the ion-exchange resin separation
Affinity chromatography: Separation using the presence of a specific affinity between biological macromolecules
Capillary electrophoresis: the components were separated according to the differences in mobility and/or partition behavior
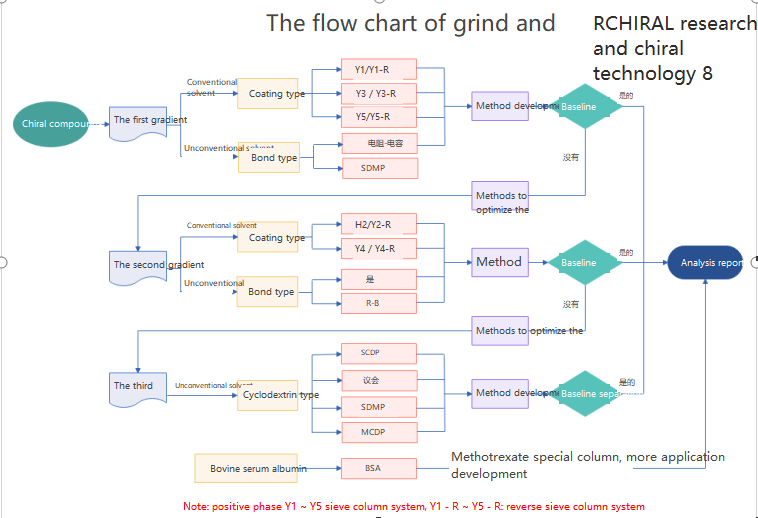
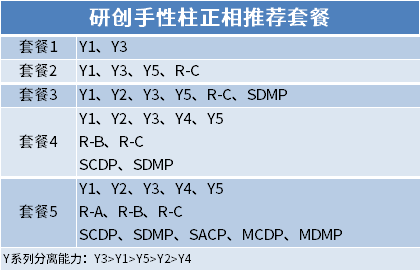
Chiral chromatography is used for the separation and analysis of chiral drugs, which can be divided into three categories: chiral derivatization reagent method; Chiral mobile phase additive method; Chiral stationary phase resolution method
Basic terminology for chromatography
The curves obtained by plotting the response signals of the components after detection of chromatographic separation against time are called chromatograms.
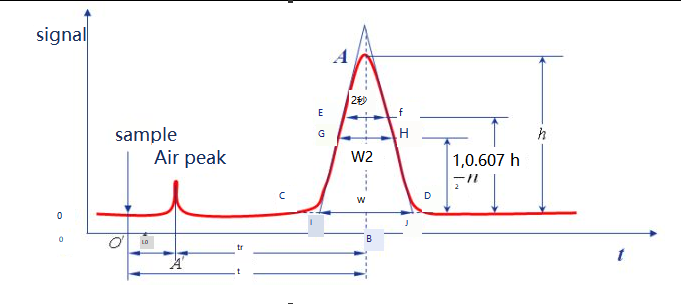
Baseline: Under certain chromatographic conditions, the curve of the signal generated when only the mobile phase passes through the detector system is called the baseline, as shown in the ot line. When the experimental condition was stable, the baseline was a line parallel to the horizontal axis. The baseline reflects the noise of the instrument, mainly the detector, over time.
Peak height: the vertical distance between the chromatographic peak point and the baseline, denoted by h, as shown in the AB 'line.
Region width: The region width of the chromatographic peak is directly related to the separation efficiency. There are three methods to describe chromatographic peak width: standard deviation σ, peak width W, and FWHM W1/2.
Standard deviation (σ) : σ is the half distance between the two inflection points on the normal distribution curve, and the value of σ indicates the degree of dispersion of the components away from the column. The larger the value of σ, the more dispersed the effluent components, and the worse the separation effect. Conversely, the effluent components are concentrated and the separation effect is good.
Peak width W: The intersection points on both sides of the chromatographic peak are used as tangent lines, and the intercept on the baseline is called peak width, or baseline width, which can also be expressed as W, as shown in Figure IJ. According to the principle of normal distribution, the relationship between peak width and standard deviation can be proved to be W=4σ.
W1/2: The peak width at half the peak height is called FWHM, as shown for the distance of GH. W1/2=2.355σ, W=1.699W1/2.
W1/2, W are both derived from σ and are used to calculate peak areas in addition to measuring the column effect. FWHM measurement is more convenient and most commonly used.
brief summary
From the chromatographic peak outflow curve, the following objectives can be achieved:
a, Qualitative analysis was performed based on the retention value of chromatographic peaks
b, quantitative analysis based on the area or peak of the chromatographic peak
C. The separation efficiency of the column was evaluated according to the retention value and peak width of the chromatographic peak
The calculation formula involved in chromatography
1. Retention value
The retention value is a parameter used to describe the degree to which a sample component is retained in the column and is used as an indicator of chromatographic characterization. Its representation method is as follows:
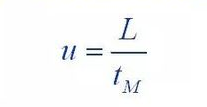
Retention time tR
Time of death tM
Adjust the retention time tR’=tR -tM
(Total time spent in stationary phase)
Volume of retention
VR=tR*F.(independent of mobile phase velocity)
Dead volume
VM=tM*Fc
(The space not occupied by the stationary phase in the flow path from the injector to the detector)
Adjust the retention volume VR’=t'R*Fc
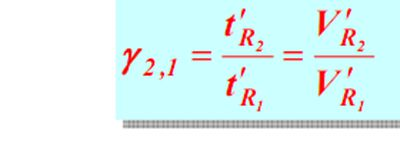
2. Relative retention value
Relative retention value, also known as separation factor, partition coefficient ratio or relative capacity factor, is the ratio of the adjusted retention time (volume) of the tested component to the adjusted retention time (volume) of the standard under certain chromatographic conditions.
Relative retention values were used to eliminate the influence of certain operating conditions, such as flow rate and fixative loss, on retention values. The standard in the relative retention value can be a component in the tested sample or a compound added artificially.
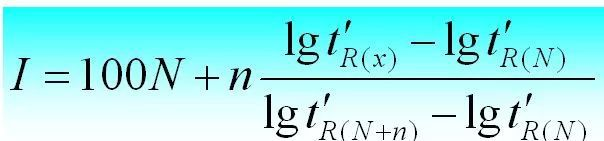
3. Retention index
The retention index is the retention index of the substance i to be tested in a fixed solution X. Two n-alanes are selected as reference substances, one of which has N carbon number and the other has N+n. Their adjusted retention time is t 'r (N) and t 'r (N+n), respectively, so that the adjusted retention time t 'r (i) of the substance i to be tested is exactly between them, that is, t 'r (N).
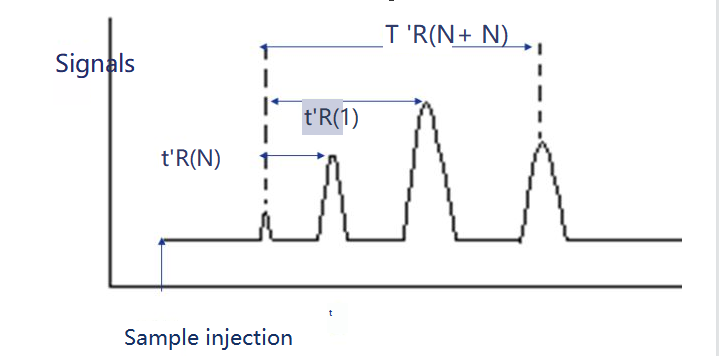
The retention index can be calculated as follows.
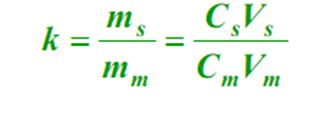
4. Capacity factor (k)
At equilibrium, the ratio of the mass of a component in the stationary phase (s) to the mobile phase (m), called the capacity factor. The formula is as follows:
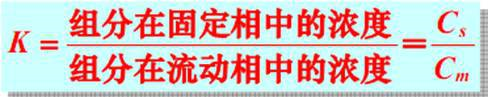
5、Partition coefficient (K) In equilibrium, the ratio of the concentration of a component in the stationary phase (s) to the mobile phase (m), called partition coefficient. The formula is as follows
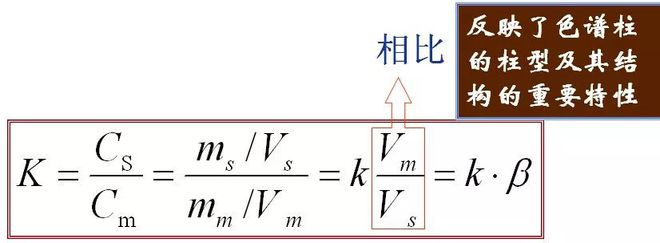
The relation between K and k:
It reflects the column type and its knot important properties of structure
brief summary
Relationship between retention value and capacity factor and partition coefficient:
Chromatographic separation is based on the difference in the adsorption or dissolution ability of each component in a fixed relative sample, which can be quantitatively expressed by the size of the partition coefficient K (or capacity factor k) value.
The components with strong adsorption or dissolution ability have large partition coefficient (or capacity factor) and long retention time. Conversely, the components with weak adsorption or solubility have a small partition coefficient and a short retention time.
Basic theory of chromatography
1. Tray theory
(1) Put forward -- thermodynamic theory
It started with the tower plate model proposed by Martin and Synge.
Fractionating column: in the tray for several times of gas-liquid equilibrium, according to the boiling point of the different separation.
Column: The components are balanced by multiple partitions between the two phases and separated according to different partition coefficients.
(2) Hypothesis
(1) There are many trays in the column, and the components can quickly reach the distribution equilibrium within the tray interval (that is, the height of the tray).
(2) The mobile phase enters the column, not continuously but pulsating, that is, each passage is a column volume.
(3) When the sample was added to each column plate, the diffusion of the sample along the column axis could be neglected.
(4) The partition coefficient is equal on all trays, independent of the amount of components. That is, the partition coefficient is constant on each taban.
(3) Principle
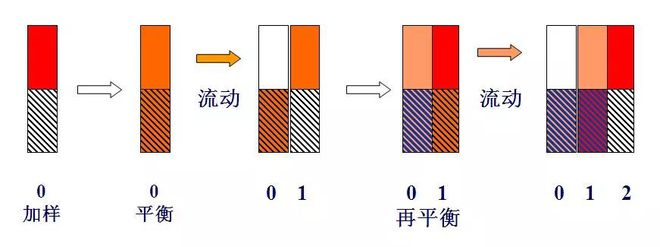
Schematic diagram of tray theory
If a component of unit mass, namely m=1 (for example, 1mg or 1μg), is added to the No. 0 tray, and after distribution equilibrium, because k=1, namely ns=nm, nm=ns=0.5.
When a plate volume (lΔV) of carrier gas enters plate 0 in the form of pulsation, the carrier gas containing the nm component in the gas phase is pushed to plate 1. At this time, the ns component in the liquid phase of plate 0 and the nm component in the gas phase of plate 1 will be redistributed between the two phases. Therefore, the total amount of components contained in plate 0 is 0.5, in which the gas and liquid phases are each 0.25, and the total amount contained in plate 1 is also 0.5. The gas and liquid phases were also 0.25.
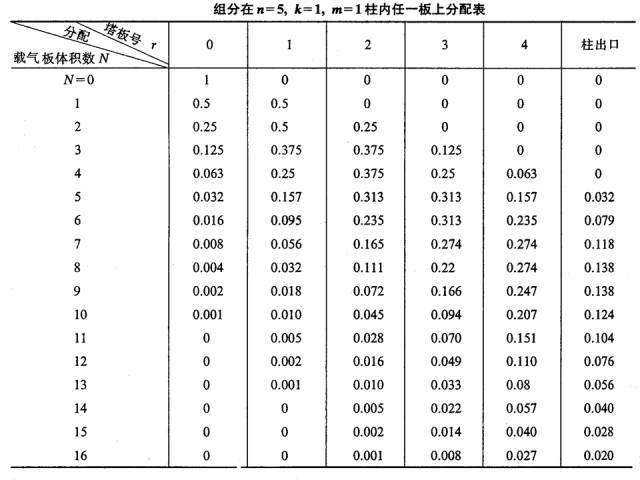
This process is repeated every time a new plate volume carrier gas is pulsated into the column (see table below).
(4)Chromatographic outflow curve equation
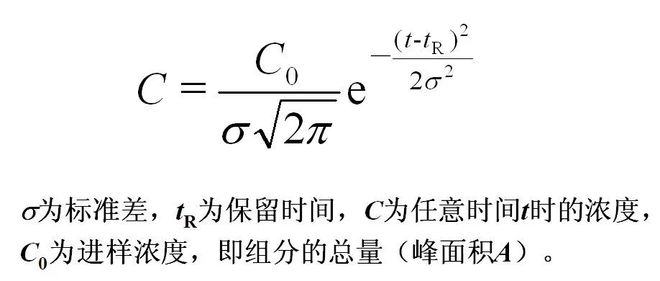
σ is the standard deviation, is the retention time, C is the concentration at any time,
C, is the injection concentration, that is, the total amount of components (peak area A).
(5) column efficiency parameters
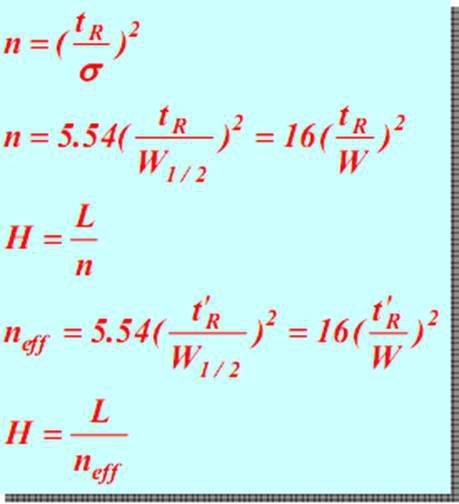
At a constant tR, the smaller W or w 1/2 (that is, the narrower peak), the larger the number of theoretical plates n, the smaller the theoretical plate height, and the higher the separation efficiency of the column. The same is true of the effective theory tray neff. Therefore, the theoretical number of trays is an index to evaluate the efficiency of columns.
(5)Characteristics and shortcomings
> Advantages
The tray theory is semi-empirical and explains the shape of the outflow curve
The partitioning and separation processes of the components are illustrated
An index to evaluate the efficiency of the column is proposed
> Limitations
The components cannot really reach the distribution equilibrium in the two phases:
Longitudinal diffusion of components in the column cannot be ignored:
The influence of various kinetic factors on the mass transfer process was not considered.
The relationship between column effect and flow velocity of mobile phase cannot be explained:
It is not clear what main factors affect the column effect
These problems are satisfactorily solved in rate theory.
2. Rate theory
In 1956, the Dutch scholar VanDeemter et al. absorbed the concept of tray theory, and combined the kinetic factors affecting the height of the tray, put forward the kinetic theory of chromatographic process - rate theory, and derived the VanDeemter equation. It regards the chromatographic process as a dynamic non-equilibrium process and studies the influence of kinetic factors on the peak broadening (i.e., column effect).
Later, Giddings and Snyder et al. proposed the liquid chromatography rate equation (namely Giddings equation) based on the VanDeemter equation (later called the gas chromatography rate equation) and according to the property difference between liquid and gas.
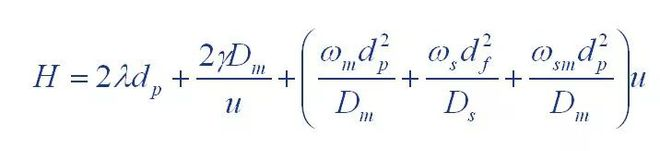
(1) Van Deemter equation
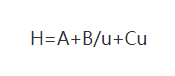
Where: H: is the height of the board
A: coefficient of eddy diffusion term
B: coefficient of molecular diffusion term
C: coefficient of the mass transfer resistance term
(2) Giddings equation
Quantitative and qualitative analysis
(1) Qualitative analysis
Qualitative chromatographic analysis is to determine the compounds represented by each chromatographic peak. Since various substances have definite retention values under certain chromatographic conditions, the retention value can be used as a qualitative index. Various chromatographic qualitative methods are currently based on retention values.
However, different substances may have similar or identical retention values under the same chromatographic conditions, that is, the retention values are not exclusive. Thus it is difficult to characterize a completely unknown sample based on retention values alone. If on the basis of understanding the source, nature and purpose of the sample, a preliminary judgment of the composition of the sample can be made, and the following methods can be used to determine the compound represented by the chromatographic peak.
1. Qualitative control using pure substances
Under certain chromatographic conditions, an unknown has only a defined retention time. Therefore, the unknown can be qualitatively identified by comparing the retention time of the known pure substance under the same chromatographic conditions with the retention time of the unknown substance. If the two are the same, the unknown substance may be a known pure substance; Otherwise, the unknown is not the pure substance.
The pure substance control method is only applicable to the unknown substance whose composition has been known, whose composition is relatively simple, and whose pure substance is known.
2. Relative retention value method
The relative retention value α, refers to the adjustment between component i and reference materials Ratio of retention values:

It only changes with the change of fixative and column temperature, and has nothing to do with other operating conditions.
At a certain stationary phase and column temperature, the adjusted retention values of component i and reference substance s are measured respectively, and then calculated according to the above formula. The obtained relative retention values can be qualitatively compared with the corresponding values in the literature.
3, adding known substances to increase the peak height method
When there are many components in the unknown sample, the obtained chromatographic peaks are too dense to be easily identified by the above method, or when the unknown sample is only used for the specified item analysis.
"First a chromatogram of an unknown sample is made, and then a further chromatogram is obtained by adding a known substance to the unknown sample." Components with increased peak heights can be known for such substances.
4. Retain the qualitative method of the index
The retention index represents the retention behavior of substances on fixatives and is currently the most widely used and internationally recognized qualitative index in GC. It has the advantages of good reproducibility, uniform standard and small temperature coefficient.
The retention index is only related to the properties of the stationary phase and the column temperature, but not to other experimental conditions. Its accuracy and reproducibility are excellent. As long as the column temperature is the same as that of the stationary phase, the literature value can be applied for identification, and it is not necessary to use the pure material for comparison.
(2)Quantitative analysis
Basis for chromatographic quantification:
The task of quantitative analysis is to find the hundred of the components in the mixed sample
Fractional content. Chromatographic quantification was based on the following: when operating conditions were consistent, was
The mass (or concentration) of the measured component is determined by the response signal given by the detector
It's proportional. Namely:
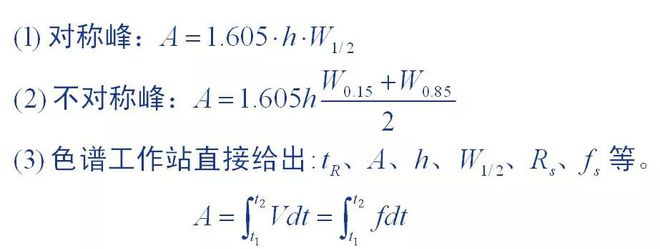
1. Peak area measurement method
Peak area is the basic quantitative data provided by chromatograms, and the accuracy of peak area measurement directly affects the quantitative results. Different measurement methods were used for chromatographic peaks with different peak shapes.
It is difficult to find the exact value of winter in quantitative analysis:
On the one hand due to the difficulty of accurately measuring the absolute injection volume: on the other hand
The peak area is dependent on the chromatographic conditions, and the chromatographic strip should be maintained when the value is measured
It is neither possible nor convenient to do the same thing. And even if you can get it right
The exact value, also because there is no unified standard and can not be directly applied.
2.Quantitative correction factor
Definition of quantitative correction factor: amount of components entering the detector (m)
The ratio of its chromatographic peak area (A) or peak height () is a proportionality constant (,
The proportionality constant is called the absolute correction factor for the component.

It is difficult to find the exact value of winter in quantitative analysis:
On the one hand due to the difficulty of accurately measuring the absolute injection volume: on the other hand
The peak area is dependent on the chromatographic conditions, and the chromatographic strip should be maintained when the value is measured
It is neither possible nor convenient to do the same thing. And even if you can get it right
The exact value, also because there is no unified standard and can not be directly applied.

That is, the relative correction factor 'of a component is the component and the reference material s
The ratio of the absolute correction factors.

It can be seen that the relative correction factor is when the quality of the component versus the standard.
When the substance s is equal, the peak area of the reference material is the peak area of the component
Multiple. If some component has mass m and peak area A, then the number of f'A
Values are equal to the peak area of the reference material with mass of. In other words,
Through the relative correction factor, the peak areas of each component can be separated
Converted to the peak area of the reference material equal to its mass, then the ratio
The standard is unified. So this is the normalized method to figure out the percentage of each component
The basis of quantity.
Method of obtaining relative correction factor: relative correction factor values were only compared with being
The measurement is related to the standard and the type of detector, but to the operation strip
It doesn't matter. Therefore, values can be retrieved from references in the literature. If the text
If you can't find the desired value in the offering, you can also determine it by yourself. Method of determination
Method: A certain amount of the measured substance ten selected reference material → made into a certain concentration
The chromatographic peak areas A and As of the two components were measured.
That's the formula.

3. Quantitative calculation method
(1) Area normalization method
The sum of the content of all the peak-free fractions was calculated as 100% for quantification
The method is called normalization. Its calculation formula is as follows:
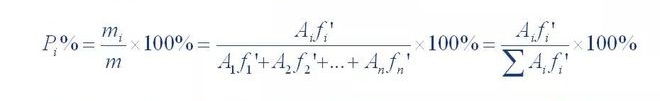
Where P,% is the percentage content of the tested components; A1, A2... A n is component 1.The peak area of 1~n; f’1, f’2... f'n is the relative correction factor for components 1 to n.
(2) external standard method
The method of quantitative comparison between the response signal of the component to be tested in the sample and the pure component to be tested as the control.
(3) Internal standard method
The so-called internal standard method is a method in which a certain amount of pure substance is added to the standard solution of the tested substance and the sample solution as an internal standard, and then analyzed and determined.
(3)standard addition method
The standard addition method, also known as the internal addition method, is to add a certain amount of (△C)
The reference of the test substance was added to the sample solution to be tested, and the test was added to the assay
The peak of the sample solution after the substance was higher than that of the original sample solution
The increment of area (△A) was used to calculate the concentration of the substance in the sample solution
Content (Cx)
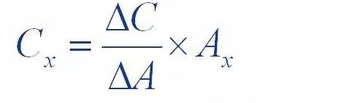
Where Ax is the peak area of the substance to be measured in the original sample.
Post time: Mar-27-2023